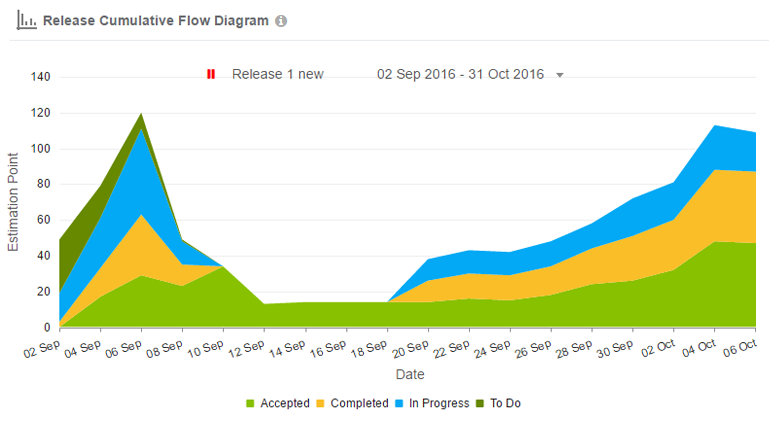
Release Cumulative Flow diagram is a great tool for tracking and forecasting projects. By the use of it you can easily check the current status: how much work has been done, what is in progress and how much is still waiting to be done in the backlog. A Cumulative Flow Diagram provides both quantitative and qualitative information about the process’s performance.
X Axis – shows the last 30 days (Date).
Y Axis – show the total of all the Estimation Points of all the user stories with in a sprint from release.
It is an area chart where each areas shows its status:
Blue color – To Do status from all the sprints within a release.
Orange color – In Progress status from all the sprints within a release.
Light Green color – Completed status from all the sprints within a release.
Dark Green color – Accepted status from all the sprints within a release.
Based on selected team, consider only those stories which are having estimation point with it.